
categories
HOT TOPICS
- The Accelerator Conundrum
- The Startup Velocity Question
- Man and Superman
- Web 3.0 = (4C + P + VS)
- The Future: End of Capitalism
- Capitalism 2.0

QualComm: More on Valuation
By Vijay Nagarajan, Guest Author
As I mentioned in my last article, QCOM has been pro-actively chasing more silicon with diversification efforts and aggressive development. There are a some key attributes to note –
- All the extra growth comes from its semiconductor business. Though at lower margins, it is a no litigation, no risk income.
- With more silicon market share, there is a more sustained growth opportunity. Standards come and go, patents expire but the semiconductor business will stay. A wider footprint is inevitable for future growth. This makes the growth model more rigid than the mobile IP dominated scenarios.
The figure below represents the revenue projections for each of the positives discussed in QualComm: Chasing More Silicon.
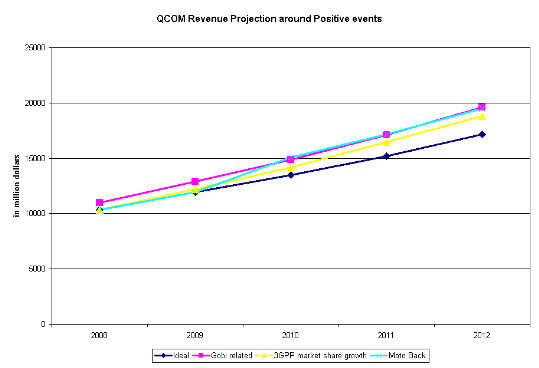
We see that each of these events raise the growth by about 3%. The valuation of the QCOM stock with Gobi in the picture goes up to $52. Motorola coming back to its fold can also raise valuation to the same number. The 3GPP market share growth puts the share value at $50.60. with these three events being mutually exclusive, their simultaneous materialization (discounting all negative events) makes it $60.40.
So, if we superpose these events and likely scenarios on the company’s earnings, we get outliers at $28 and $60. But if I were to further pick a sequence of events from this list I have created, then I will go with
- Domino Effect
- Gobi
- 3GPP market share growth
This yields a composite share valuation of $44.60. I am willing to bet this much for now. To me, more than the number itself, it is the strength it represents. While I will conclude this series in my next piece, with all these details in place, I will pose Ms. Mitra’s question back to her –
Is QCOM still a stock to short?
Note on the valuation: Cash flow was obtained as 60% of the operating profits by projecting historical data. Operating margins were computed for each scenario and year based on the QTL/QCT revenue mix. Discount was assumed at 8%.
This segment is a part in the series : QualComm
. Legal Battles Galore
. The Aftermath
. The Margins
. The 3G Goldmine
. Digging Gold
. The Nokia War
. The effect on Valuation
. Chasing More Silicon
. More on Valuation
. EpilogueMore »»
